
Partition values – Solutions
Exercise
Q. 1. Choose the correct option :
1) Statments that do not apply to Quartiles.
a) First arrange the values in ascending or descending order.
b) Observation can be divided into 4 parts.
c) They are represented as Q₁, Q₂, and Q₃.
d) Q₂ is also known as median.
Options:
1. a
2. a and b
3. a, b, and c
4. None of these
Answer: 4) None of these
Explanation: All statements (a, b, c, d) correctly apply to quartiles. Quartiles require data to be arranged in ascending or descending order, divide observations into 4 parts, are represented as Q₁, Q₂, Q₃, and Q₂ is the median.
2) Calculate D₇ from the given data:
Data: 4, 5, 6, 7, 8, 9, 10, 11, 12
Solution:
Arrange the data in ascending order: 4, 5, 6, 7, 8, 9, 10, 11, 12
n = 9 (number of observations)
For deciles, Dₖ = size of k (n + 1)/10 th observation
For D₇, k = 7:
D₇ = size of 7 (9 + 1)/10 th observation
= 7 × 10/10 = 7th observation
The 7th observation in the ordered data is 10.
Answer: D₇ = 10
Options:
1. 7
2. 9
3. 10
4. 12
Correct Option: 3) 10
3) Statements related to partition values that are correct:
a) Exact divisions of percentiles into 100 parts gives 99 points
b) Deciles have total 9 parts
c) Quartiles are shown by Q₁, Q₂, and Q₃
d) Symbolically, Percentiles and Deciles are shown by P and DOptions:
1. a and c
2. a and b
3. a, b, and c
4. a, c, and d
Answer: 4) a, c, and d
Explanation:
a) Correct. Percentiles divide data into 100 equal parts, resulting in 99 dividing points (P₁ to P₉₉).
b) Incorrect. Deciles divide data into 10 parts, so there are 9 dividing points (D₁ to D₉), not 9 parts.
c) Correct. Quartiles are denoted as Q₁, Q₂, and Q₃.
d) Correct. Percentiles are denoted by P and deciles by D.
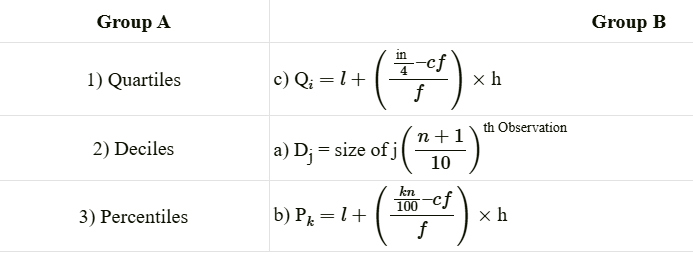
Q.2 Identify the correct pairs from the given options:
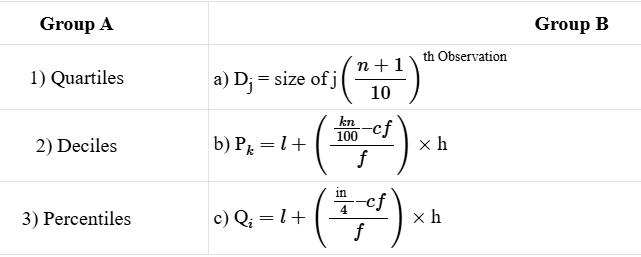
Options:
1) 1-b, 2-c, 3-a
2) 1-c, 2-a, 3-b
3) 1-c, 2-b, 3-a
4) 1-a, 2-b, 3-c
Answer (b): 2) 1-c, 2-a, 3-b
Q.3. Give economic terms:
1. Procedure for dividing the data into equal parts.
2. Value that divides the series into ten equal parts.
3. Value that divides the whole set of observations into four equal parts.
Answers:
1. Partitioning
2. Decile
3. Quartile
Q.4. Solve the following:
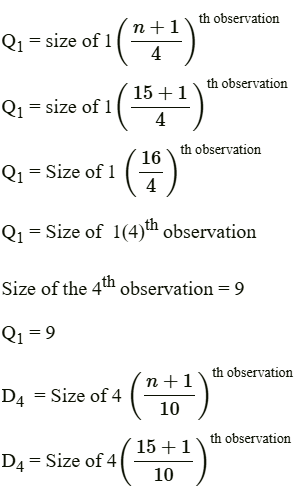
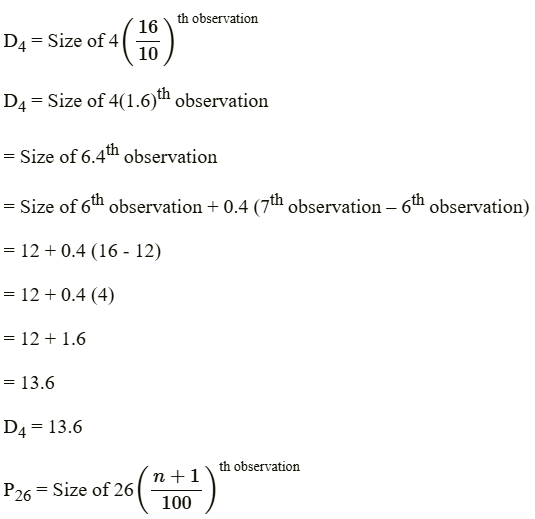
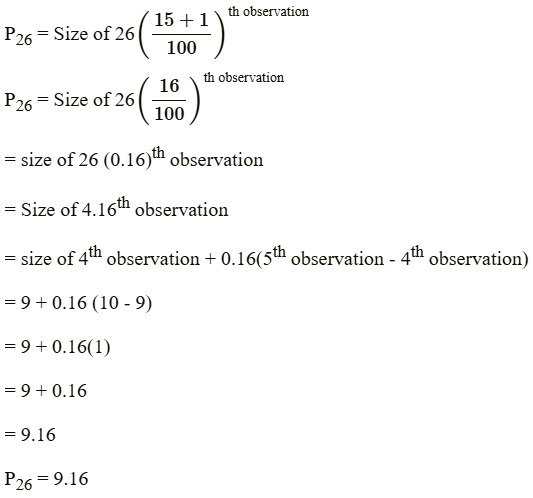
1) Calculate Q₁, D₄, and P₂6 for the following
data: 18, 24, 45, 29, 4, 7, 28, 49, 16, 26, 25, 12, 10, 9, 8
Answers:
2) Calculate Q3, D₅, and P₃₅ for the given data.
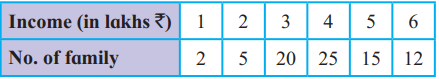
Answer: Q3, = ₹ 5 Lakhs, D₅, = ₹ 4 Lakhs, P₃₅ = ₹ 4 Lakhs
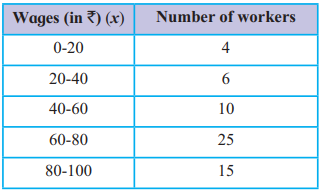
3) Find out P₅₀ for the following data:
Answer:
Step 1: Create cumulative frequency table
| Class Interval | f | cf |
|---|---|---|
| 0-20 | 4 | 4 |
| 20-40 | 6 | 10 |
| 40-60 | 10 | 20 |
| 60-80 | 25 | 45 |
| 80-100 | 15 | 60 |
Total (n) = 60
P₅₀ = 50th Percentile = Median
Step 2: Find class containing the 30th value (50% of 60)
cf before 60–80 = 20
cf after 60–80 = 45
So, P₅₀ class = 60–80
Step 3: Use percentile formula for grouped data:
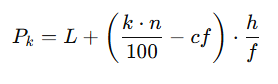
Where:
L = 60 (lower boundary of class)
k = 50
n = 60
cf = 20 (cumulative frequency before the class)
f = 25 (frequency of the class)
h = 20 (class width)
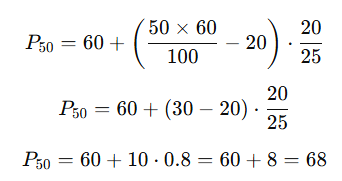
Final Answer: P₅₀ = ₹ 68
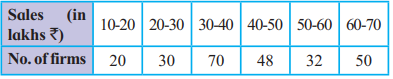
4) Calculate Q₃ for the following data.
Answer:
Step 1: Prepare the cumulative frequency (C.F.) table.
| Class Interval (Sales ₹ in lakhs) | Frequency (f) | Cumulative Frequency (C.F.) |
|---|---|---|
| 10 – 20 | 20 | 20 |
| 20 – 30 | 30 | 50 |
| 30 – 40 | 70 | 120 |
| 40 – 50 | 48 | 168 |
| 50 – 60 | 32 | 200 |
| 60 – 70 | 50 | 250 |
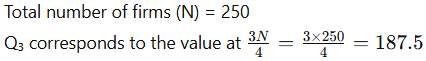
Step 2: Identify the Q₃ class
Find the class where the cumulative frequency is just greater than or equal to 187.5.
C.F. just greater than 187.5 is 200, which lies in the class 50 – 60.
So, Q₃ class = 50 – 60
Step 3: Apply the Q₃ formula:
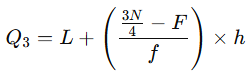
Where:
L = lower boundary of Q₃ class = 50
N = total frequency = 250
F = cumulative frequency before Q₃ class = 168
f = frequency of Q₃ class = 32
h = class width = 10
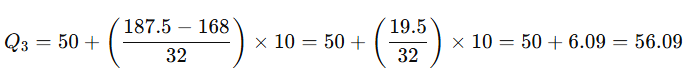
Final Answer: Q₃ = ₹56.09 lakhs
5) Calculate D₇ for the following data.
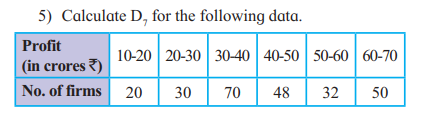
Answer: D₇ = ₹ 52.1875
6) Calculate P₁₅ for the following data.
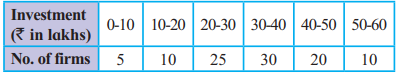
Answer: P₁₅ = ₹ 20 lakhs
Q. 5. State with reasons whether you agree or disagree with the following statements :
1) Partition values have application only in theory but not in practice.
Disagree.
Reason: Partition values (like quartiles, deciles, percentiles) are widely used in both theory and practice. In practice, they are applied in fields like statistics, finance (e.g., analyzing income distributions), data science (e.g., box plots for outlier detection), and economics (e.g., percentile-based performance metrics). They provide insights into data distribution, dispersion, and skewness, making them valuable for real-world decision-making.
2. Average can misinterpret the representative value.
Agree.
Reason: The average (mean) can be misleading in datasets with extreme values or skewness. For example, in a dataset with a few very large values (e.g., income distributions), the mean may overestimate the typical value, misrepresenting the central tendency. In such cases, the median or mode may better represent the data.
3. Median is also known as second quartile.
Agree.
Reason: The median is the value that divides a dataset into two equal halves. In the context of quartiles, the second quartile (Q2) is defined as the median, as it represents the 50th percentile of the data. Thus, the median is indeed the second quartile.
Q. 6. Answer the following questions on the basis of the given table :
![]()
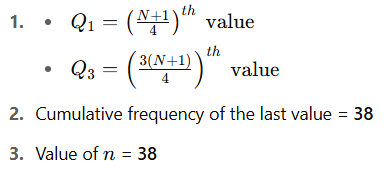
1) Write the formula of Q₁ and Q₃
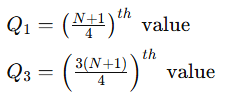
Where N is the total number of observations (sum of frequencies).
2) Find out the cumulative frequency of the last value in the above data.
First, calculate cumulative frequencies:
| Marks | Frequency (f) | Cumulative Frequency (CF) |
|---|---|---|
| 10 | 4 | 4 |
| 20 | 7 | 11 |
| 30 | 13 | 24 |
| 40 | 8 | 32 |
| 50 | 6 | 38 |
So, Cumulative Frequency of the last value (50) = 38
3) Find out the value of ‘n’ in the above data.
‘n’ refers to the total number of students.
So,
n = 4 + 7 + 13 + 8 + 6 = 38
Final Answers:
Leave a Reply