
Global Climate Change
Introduction
- Definition: Global climate change refers to long-term shifts in weather patterns, temperature, precipitation, and other climatic elements, primarily driven by human activities, though natural factors also play a role.
- Significance: The Earth’s average surface temperature has risen by approximately 0.8°C over the last century, leading to significant environmental and societal impacts.
- Scope: This chapter explores the causes, indicators, effects, tools for studying climate change, and measures to combat it, with a focus on global and Indian contexts.
1. Measuring Global Temperature Changes
Global Temperature Trends:
- From 1985 to 2015, global monthly temperatures were compared to the 20th-century average (Fig. 5.1).
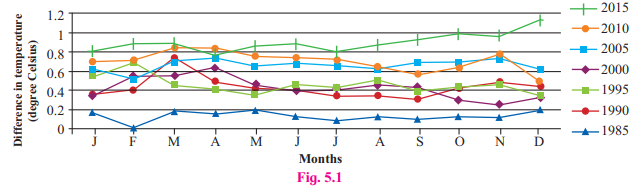
- Key Observations:
- 1985: Least difference in temperature (close to 0°C).
- 2015: Highest difference, approximately 1.21°C above the 20th-century mean.
- Temperature differences vary by month due to seasonal variations, regional climate patterns, and atmospheric circulation (e.g., monsoons, jet streams).
- Scientific Method:
- Scientists combine air temperature data from land (weather stations) and ocean surfaces (ships, buoys, satellites).
- Anomalies: Differences between daily temperatures and a 30-year average (“normal”) for a location. Positive anomalies indicate warmer conditions; negative indicate cooler.
- Monthly and seasonal anomalies are averaged to track long-term trends.
- Earth’s Surface Temperature:
- Average global temperature: ~14°C, suitable for life compared to other planets (e.g., Venus: 460°C, Mars: -60°C).
- A 0.8°C rise, though small, has profound impacts due to its global scale and rapid rate.
2. Causes of Climate Change
A. Natural Causes
- Solar Output Variations:
- Changes in the Sun’s energy output affect Earth’s insolation. Low output can cool the planet.
- Milankovitch Oscillations:
- Variations in Earth’s orbit, axial tilt, and precession alter insolation, influencing climate (e.g., triggering ice ages when Earth is farther from the Sun).
- Volcanism:
- Eruptions release aerosols (e.g., sulfur dioxide) that reflect sunlight, temporarily cooling Earth. Examples: El Chichón (1982), Pinatubo (1991).
- Goldilocks Zone:
- Earth’s position in the habitable zone shifts as the Sun’s size changes, affecting long-term climate (cooler in early history, warming over time).
B. Anthropogenic Causes
Primary Driver: Human activities since the mid-20th century, especially post-industrialization.
Key Contributors:
- Fossil Fuel Combustion: Releases CO2, the primary greenhouse gas (GHG), from industries, vehicles, and power plants.
- Deforestation: Reduces CO2 absorption by trees and releases stored carbon when forests are burned.
- Industrialization: Increases emissions of CO2, methane (CH4), and nitrous oxide (N2O) through manufacturing and agriculture.
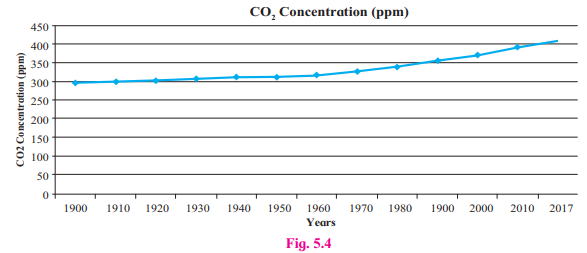
CO2 Levels:
- Pre-industrial: ~280 ppm; 2017: >400 ppm (Fig. 5.4).
- WHO: >350 ppm is harmful to the environment.
- Atmospheric CO2 takes 20-25 years to stabilize, amplifying human impact.
3. Greenhouse Gases and Their Role
Definition: Gases that trap heat in the atmosphere, increasing Earth’s temperature (greenhouse effect).
Major Greenhouse Gases (Fig. 5.1, Global Greenhouse Gas Emissions):
- Water Vapour: Highest contribution (~95%), natural but amplified by warming.
- Carbon Dioxide (CO2): ~3.6%, from fossil fuels, deforestation (human and natural sources).
- Methane (CH4): ~0.95%, from agriculture, livestock, landfills (human and natural).
- Nitrous Oxide (N2O): ~0.36%, from fertilizers, industrial processes (mostly human).
- Miscellaneous Gases: ~0.072%, e.g., CFCs (human-made, ozone-depleting).
Human Control:
- CO2, CH4, N2O, and CFCs can be controlled through reduced emissions, afforestation, and regulations.
- Water vapour is largely natural and harder to control directly.
Impact: Increased heat-holding capacity of the atmosphere drives global warming.
4. Effects of Global Warming
A. Direct Effects
- Heat Waves:
- Increased atmospheric heat capacity intensifies summer temperatures, leading to deadly heat waves (e.g., Chicago 1995, Paris 2003).
- Heat Islands:
- Urban areas with paved surfaces and concrete absorb and retain heat, amplifying temperatures compared to rural areas.
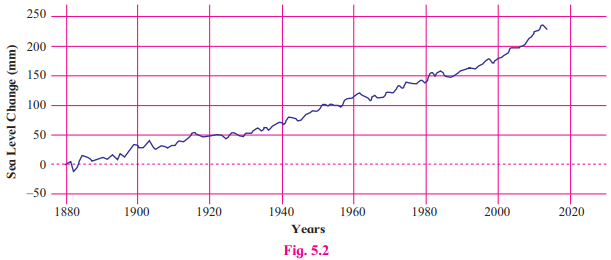
- Sea Level Rise (Fig. 5.2):
- Global sea level has risen ~50 mm since the 1990s, at ~3 mm/year.
- Causes: Melting glaciers, ice sheets, and thermal expansion of seawater.
- Impacts: Flooding of coastal areas, submersion of islands (e.g., Maldives), loss of habitats for fish, birds, and plants.
- India: Projected rise of 9-90 cm by 2100, threatening Kutch, Mumbai, Konkan, Kerala, and eastern deltas (Ganga, Krishna, Godavari, Kaveri, Mahanadi).
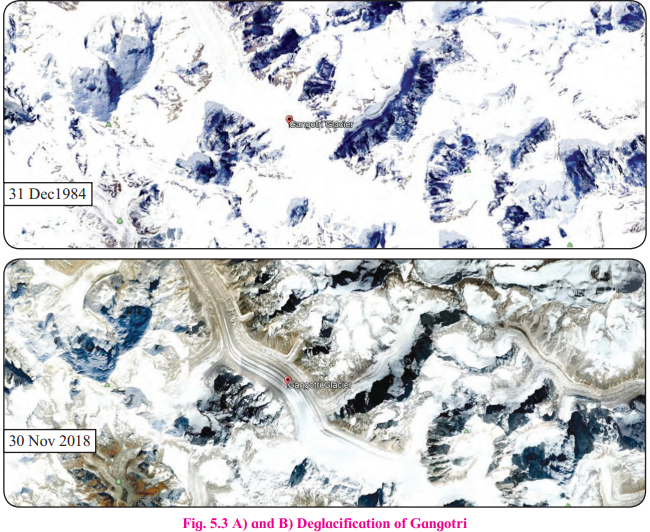
- Glacial Retreat (Fig. 5.3 A & B):
- Glaciers like Gangotri (Himalayas) have retreated >850 m in 25 years (~22 m/year).
- Other examples: Mt. Kilimanjaro, Alps, polar regions.
- Cause: Faster melting than ice formation due to rising temperatures.
B. Indirect Effects
- Jellyfish Proliferation:
- Warmer, more acidic oceans favor jellyfish reproduction, altering marine ecosystems.
- Spread of Insects:
- Warmer temperatures and wetter conditions increase mosquito populations, spreading diseases like dengue in new regions.
- Coral Bleaching:
- Temperature rises of 1°-2°C cause corals to expel algae, leading to bleaching and death.
- Over 20% of coral reefs lost globally, impacting marine biodiversity.
- Changes in Seasons:
- Altered monsoon arrivals, rainfall patterns, and flowering seasons, as observed by elders.
- Increased Extreme Weather:
- More frequent and intense floods (e.g., Mumbai 2005, Kedarnath 2013), cyclones (e.g., Chennai 2015), and droughts (doubled land area since 1970s).
5. Indicators of Climate Change
- Retreat of Glaciers: Visible in Gangotri, Alps, and polar regions.
- Increased Floods: Flash floods in urban areas and coastal flooding (e.g., Venice).
- Increased Cyclones: Higher frequency and intensity in tropical regions.
- Temperature Extremes: Rising minimum and maximum temperatures globally.
- Sea Level Rise: Measurable through tidal and satellite data.
- Ecosystem Changes: Shifts in species distribution (e.g., mosquitoes, jellyfish) and coral bleaching.
6. Tools for Studying Paleoclimatology
Paleoclimatology: Study of past climates using proxy data, as direct measurements are available only for the last 140 years.
Key Tools:
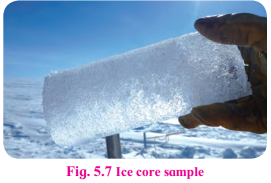
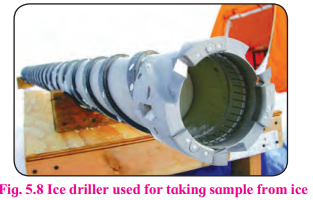
1. Ice Cores (Fig. 5.7, 5.8):
- Samples from Greenland, Antarctica, and mountain glaciers show annual snow layers.
- Summer and winter snow differ, revealing past climate conditions.
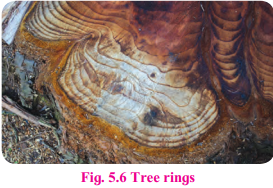
2. Tree Rings (Fig. 5.6):
- Variations in ring width reflect environmental conditions (e.g., wet vs. dry years).
3. Coral Reefs (Fig. 5.5):
- Seasonal growth rings (calcium carbonate density) indicate past ocean temperatures.

4. Ocean Sediments:
- Deposits preserve climate signals, e.g., temperature and precipitation patterns.
Historical Evidence:
- Geological records (glacial lake sediments), fossil records (e.g., mammoths), and tree rings indicate past glacial and interglacial periods.
7. Historical Context of Climate Change
- Not a New Phenomenon:
- Earth has experienced multiple climate shifts, including ice ages and interglacial periods.
- Example: Rajasthan was wet and cool 8,000 years ago; last glacial period ended ~10,000 years ago.
- Ice Ages:
- Periods of significant polar ice expansion due to global cooling.
- Current era: Interglacial period within an ice age, characterized by warmer conditions.
- Evidence:
- Geological records (sediments, fossils), tree rings, and coral reefs show natural climate variability.
- Warm periods (e.g., 500-300 million years ago) and cool periods (e.g., early Earth in outer Goldilocks Zone).
- Why Current Warming is Concerning:
- Rate: Current warming is ~10 times faster than post-glacial warming.
- Cause: Largely anthropogenic (post-1950s), driven by GHG emissions.
- Scale: Global impacts observed via satellites, ice cores, and other advanced technologies.
8. Measures to Combat Climate Change
A. Global Efforts
- Research and Monitoring:
- 1950s: Precise CO2 measurements confirmed rising levels.
- 1980s: Established link between rising temperatures and GHGs.
- Intergovernmental Panel on Climate Change (IPCC):
- Publishes reports (5 annual, latest: 2018 SR1.5 on 1.5°C warming).
- Sets targets to limit warming to 1.5°C, requiring zero emissions by 2030-2050.
- International Agreements:
- UNFCCC (1992): Framework for global climate action.
- Kyoto Protocol: Commits countries to reduce GHG emissions.
- Montreal Protocol (1987): Phases out ozone-depleting substances.
- Paris Agreement (2016): Aims to limit warming to 1.5°C-2°C.
- Nobel Peace Prize (2007): Awarded to IPCC for climate change efforts.
B. India’s Initiatives
- Vulnerabilities:
- Peculiar economy (agriculture-dependent) and geography (coastal areas, Himalayas).
- High risk to sea level rise, floods, and droughts.
- Key Measures:
- National Action Plan on Climate Change (NAPCC, 2008):
- 8 sub-missions to address mitigation, adaptation, and clean energy.
- National Adaptation Fund for Climate Change (NAFCC):
- Supports states/UTs vulnerable to climate impacts; managed by NABARD.
- National Clean Energy Fund (NCEF):
- Funds R&D in clean energy using carbon tax on coal; provides up to 40% project cost as loans/grants.
- Clean Energy Promotion: Solar, wind, and other renewables to reduce fossil fuel dependence.
- Environmental Protection: Afforestation, pollution control, and sustainable development.
- National Action Plan on Climate Change (NAPCC, 2008):
C. Lifestyle Changes
- Individual Actions:
- Use energy-efficient devices, reduce plastic use, and conserve water.
- Walk or cycle for short distances, compost organic waste, and support recycling.
- Reduce dependence on wood and non-renewable resources.
- Community Efforts:
- Educate others, participate in tree-planting drives, and advocate for local policies.
9. Climate Change and India
- Challenges:
- Developing nation with high emissions from industrialization and urbanization.
- Balancing development needs with environmental sustainability.
- Vulnerable regions: Coastal areas (Mumbai, Kerala), Himalayan glaciers, eastern deltas.
- Opportunities:
- Leadership in global climate action (e.g., Paris Agreement commitments).
- Investment in renewables and sustainable agriculture to enhance resilience.
10. Key Graphs and Questions
A. Fig. 5.1: Global Temperature Anomalies (1985-2015)
- Shows: Difference between global monthly temperatures and 20th-century average.
- Key Points:
- 2015: Highest anomaly (1.21°C).
- 1985: Least difference (~0°C).
- Monthly variations due to seasonal and regional climate dynamics.
B. Fig. 5.2: Sea Level Change (1880-2020)
- Shows: Global sea level rise (~50 mm since 1990s, ~3 mm/year).
- Key Points:
- ~225 mm rise around 2015-2020.
- Correlates with rising temperatures (melting ice, thermal expansion).
- Indicates accelerating climate change impacts.
C. Fig. 5.4: CO2 Concentration (1900-2017)
- Shows: CO2 levels in ppm, rising from ~300 ppm (1900) to >400 ppm (2017).
- Key Points:
- Phenomenal increase since the 1950s.
- Causes: Fossil fuel burning, deforestation, industrialization.
- Impacts: Health, agriculture, air pollution, and global warming.
Leave a Reply