
Population : Part – 1
Introduction
- Geography studies how humans interact with their environment.
- Population Geography, a branch of Human Geography, focuses on:
- Human population: Numbers, distribution, and patterns across the Earth.
- Qualitative and quantitative aspects: Characteristics like age, sex, education, and occupation.
- Impact on economy and development: How population influences a region’s growth.
In this chapter, humans are studied as a resource that shapes and is shaped by the environment.
1. Distribution of Population
The world’s population in 2019 was approximately 7.7 billion.
Population is unevenly distributed across continents due to various factors.
Continent-wise Population and Landmass (2019 Data)
| Continent | % of Landmass | % of Population | Key Observations |
|---|---|---|---|
| Asia | 29.20% | 59.65% | Largest landmass and population. Supports ~60% of the world’s population despite having ~30% of land. |
| Africa | 20.40% | 16.96% | Large landmass but supports a smaller population share. |
| North America | 16.50% | 4.75% | Large landmass but low population share. |
| South America | 12.00% | 5.90% | Similar to North America, low population relative to land. |
| Europe | 8.40% | 9.69% | Small landmass but moderate population share. |
| Australia | 6.80% | 0.55% | Small landmass and very low population. |
| Antarctica | 9.20% | 0% | No permanent human settlements due to harsh conditions. |
Population Density
Definition: Number of people living per unit area (usually per square kilometer).
Formula:
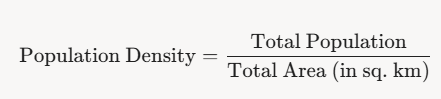
- Helps understand how crowded or sparse a region is.
- Example: Asia has high density due to a large population in a relatively smaller land area.
Using the data for the 10 most populated countries in 2018, calculate density:
| Rank | Country | Population (Crores) | Area (Lakh sq. km) | Population Density (per sq. km) |
|---|---|---|---|---|
| 1 | China | 142.8 | 96.0 | 148.75 |
| 2 | India | 135.3 | 32.9 | 411.25 |
| 3 | USA | 32.7 | 95.3 | 34.31 |
| 4 | Indonesia | 26.8 | 19.1 | 140.31 |
| 5 | Pakistan | 21.2 | 8.9 | 238.20 |
| 6 | Brazil | 20.9 | 85.2 | 24.53 |
| 7 | Nigeria | 19.6 | 9.2 | 213.04 |
| 8 | Bangladesh | 16.1 | 1.5 | 1073.33 |
| 9 | Russia | 14.6 | 171.0 | 8.54 |
| 10 | Mexico | 12.6 | 19.7 | 63.96 |
Observation:
- Bangladesh has the highest density (1073.33 people/sq. km) due to a large population in a small area.
- Russia has the lowest density (8.54 people/sq. km) due to a vast area with a smaller population.
2. Patterns of Population Distribution
Population distribution refers to how people are spread across the Earth’s surface (see Fig 1.2).
Key Observations:
- High-density areas: Coastal plains, river valleys (e.g., Ganges, Nile), and fertile lands.
- Low-density areas: Deserts, snow-covered regions (e.g., Arctic), forests, and mountainous areas.
- Population density varies due to physical and human factors.
Physical Factors Affecting Population Distribution
| Factor | High Density | Low Density | Examples |
|---|---|---|---|
| Relief (Landforms) | Flat plains, gentle slopes (good for agriculture, roads, industries) | Mountainous, hilly areas (difficult for settlement) | Ganges Plains (high), Himalayas (low) |
| Climate | Equable climate (moderate temperature, no extremes) | Extreme climates (very hot deserts, cold polar regions, heavy rainfall areas) | Mediterranean regions (high), Sahara Desert (low) |
| Water Availability | Areas with fresh water (rivers, lakes, oases) | Areas with scarce water (deserts) | Nile Valley (high), Thar Desert (low except near oases like Phalodi) |
| Soils | Fertile soils (loamy, volcanic, black soils) | Infertile or rocky soils | Mississippi Flood Plains (high), Amazon interior (low) |
Human Factors Affecting Population Distribution
| Factor | High Density | Low Density | Examples |
|---|---|---|---|
| Agriculture | High agricultural productivity (use of fertilizers, irrigation) | Subsistence farming, low productivity | Punjab, India (high), Amazon Basin (low) |
| Mining | Areas with mineral deposits (attract industries, jobs) | Areas without minerals | Chota Nagpur Plateau, India (high), Australian interior (low except gold mines) |
| Transportation | Well-connected areas (roads, highways, ports) | Remote, inaccessible areas | Coastal India (high), Himalayan interiors (low) |
| Urbanization | Cities with industries, jobs, education, and services | Rural areas with limited facilities | Mumbai (high), rural Rajasthan (low) |
| Economic Factors | Business hubs, financial centers | Areas with low economic growth | Tokyo (high), Louisiana (low) |
| Government Policies | Incentives for settlement (e.g., Siberia) | Policies to reduce population (e.g., Tokyo decentralization) | Siberia (high due to incentives), Tokyo (decreasing) |
| Cultural Factors | Areas with cultural or religious significance | Areas with less cultural pull | Varanasi, India (high), remote tribal areas (low) |
Other Factors
- Distance from the sea: Coastal areas are densely populated due to trade and transport (e.g., Mumbai, New York).
- Natural harbors: Attract settlements (e.g., Singapore).
- Energy sources: Areas with coal, oil, or hydropower attract industries (e.g., Manchurian region, China).
- Migration: Movement of people due to jobs or conflicts affects density.
- Technology: Advanced technology supports settlement in harsh areas (e.g., oil fields in Saudi Arabia).
3. Components of Population Change
- Population change: Change in the number of people in an area over time, expressed as:
- Absolute numbers (e.g., population increased by 1 million).
- Percentage (e.g., population grew by 2%).
Population change can be positive (growth) or negative (decline).
Three components:
- Births: Number of live births.
- Deaths: Number of deaths.
- Migration: Movement of people in or out of an area.
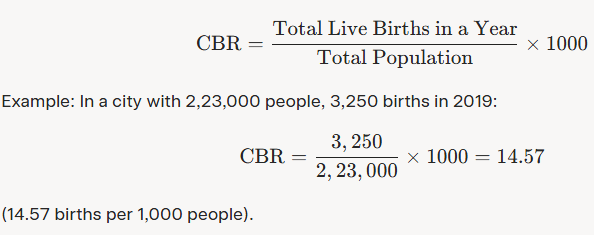
Crude Birth Rate (CBR)
Definition: Number of live births per 1,000 people in a year.
Formula
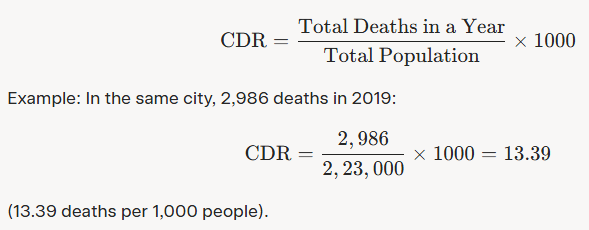
Crude Death Rate (CDR)
Definition: Number of deaths per 1,000 people in a year.
Formula
Population Growth
Formula:
Population Growth = Present Population – Earlier Population
Growth Rate:
Impact of Birth and Death Rates:
- Births > Deaths: Population increases.
- Deaths > Births: Population decreases.
- Births = Deaths: Population remains stable (rare).
Arrange countries by Crude Birth Rate (CBR) and Crude Death Rate (CDR) (2017 data):
| Country | CBR | CDR |
|---|---|---|
| Niger | 46.5 | 8.5 |
| India | 18.1 | 7.2 |
| China | 12.4 | 7.1 |
| USA | 11.8 | 8.5 |
| Sweden | 11.5 | 9.1 |
| Greece | 8.2 | 11.6 |
Ascending Order:
CBR: Greece (8.2), Sweden (11.5), USA (11.8), China (12.4), India (18.1), Niger (46.5).
CDR: China (7.1), India (7.2), Niger (8.5), USA (8.5), Sweden (9.1), Greece (11.6).
4. Demographic Transition Theory
Explains how population growth changes with economic development.
Countries pass through five stages based on birth rates and death rates (see Fig 1.7).
Stages of Demographic Transition
| Stage | Birth Rate | Death Rate | Population Growth | Characteristics | Examples |
|---|---|---|---|---|---|
| 1: High Stationary | High | High | Stable/Low | Agriculture-based economy, low technology, poor healthcare, large families. No countries today. | None currently |
| 2: Early Expanding | High | Decreasing | Rapid (Explosion) | Improved healthcare, technology, and agriculture reduce deaths. High births continue. | Congo, Bangladesh, Niger, Uganda |
| 3: Late Expanding | Decreasing | Low | Moderate Growth | Better living standards, education, and family planning reduce births. Poverty declines. | China, India |
| 4: Low Stationary | Low | Low | Minimal Growth | High living standards, advanced healthcare, small families, developed economy. | USA, Canada |
| 5: Declining | Very Low | Low/Equal | Negative/Minimal | Aging population, very low births, high living standards, tertiary economy. | Sweden, Finland, Japan |
Leave a Reply