
Population : Part – 2
Introduction
- Population as a Human Resource: Population is not just about numbers; it is a valuable resource because people’s physical and intellectual abilities drive a region’s development.
- Impact of Population: The way human resources are used affects the development of natural resources and economic activities. Poorly managed human resources can harm the use of other resources.
- Population Geography: This field studies population characteristics like:
- Population structure (age, sex, literacy, etc.)
- Sex ratio
- Literacy rate
- Occupational structure
- Rural-urban composition
- Migration
1. Population Composition
Population composition refers to the characteristics of a population, such as age, sex, literacy, and occupation.
1.1 Age Structure
- Definition: Age structure shows how many people belong to different age groups (e.g., infants, children, teenagers, young adults, adults, and elderly).
- Importance: The proportion of people in each age group affects a country’s development and economy.
- A large working-age population (15–59 years) means more workers and economic growth.
- A high number of children (0–15 years) or elderly (60+ years) increases the dependency ratio (people who rely on others for support).
Population Pyramids:
- These are graphs used to show the age and gender distribution of a population.
- Y-axis: Shows age groups.
- X-axis: Shows the number or percentage of people (males on the left, females on the right).
- Base: Represents children (younger population).
- Apex: Represents elderly (older population).
Types of Population Pyramids (Fig. 2.1)
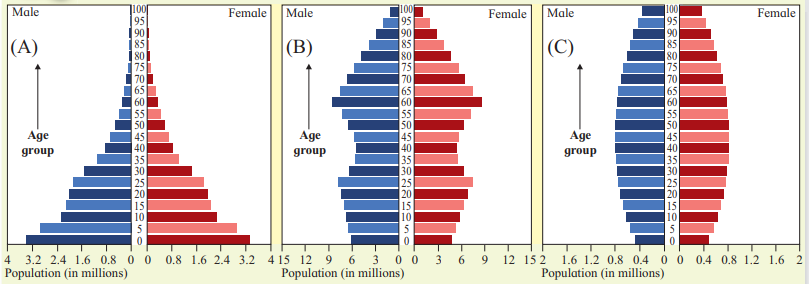
Expansive Pyramid (A):
- Shape: Broad base, narrow apex.
- Features: High birth rate and high death rate, more young people, fewer elderly.
- Example: Developing countries with growing populations.
Constrictive Pyramid (B):
- Shape: Narrow base, broader apex.
- Features: Low birth rate, low death rate, more elderly, fewer young people.
- Example: Developed countries with aging populations.
Stationary Pyramid (C):
- Shape: Similar width for all age groups.
- Features: Very low birth and death rates, stable population with little growth.
- Example: Highly developed countries with balanced populations.
India’s Population Pyramid (Fig. 2.2, 2016)
Type: Expansive pyramid (broad base, high birth rate).
Age Structure:
- Large young population (0–15 years).
- Significant working-age population (15–59 years).
- Smaller elderly population (60+ years).
- Indicates a growing population with potential for economic growth if managed well.
1.2 Sex Composition
- Definition: Sex composition refers to the number of males and females in a population.
- Sex Ratio:
It is the ratio of females to males, calculated as:

- Global Average: 990 females per 1000 males.
- Highest Sex Ratio: Countries like Latvia, Estonia, Russia, Ukraine (e.g., 1162 females per 1000 males).
- Lowest Sex Ratio: Saudi Arabia (667 females per 1000 males).
- Asia: Generally low sex ratio (e.g., China, India, Pakistan, Afghanistan).
- India (Census 2011): 943 females per 1000 males.
- Importance: Sex ratio reflects the status of women in a country and affects social and economic development.
1.3 Demographic Dividend
Definition: Demographic dividend is the economic growth that occurs when a country’s working-age population grows larger than its dependent population (children and elderly).
How It Happens:
- Declining birth and death rates lead to fewer children and a larger working-age population.
- With fewer dependents, resources can be invested in education, health, and infrastructure, boosting the economy.
India’s Demographic Dividend (Table 2.1):
- 2001–10: Ratio of working to non-working population: 1.33:1, 57.1% working population.
- 2011–20: Ratio: 1.53:1, 60.5% working population.
- 2021–30 (projected): Ratio: 1.81:1, 64.4% working population.
- 2031–40 (projected): Ratio: 1.72:1, 63.2% working population.
Key Points:
- A higher working population increases economic productivity.
- If the ratio decreases, dependency rises, slowing economic growth.
- The dividend depends on government policies in education, health, and employment.
Benefits of Demographic Dividend
- Increased Savings: Fewer dependents allow people to save more, stimulating the economy.
- Better Education: Parents invest more in fewer children, building human capital.
- Women in Workforce: More women join the labor force, boosting economic growth.
- Higher Per Capita GDP: Lower dependency reduces economic burden.
1.4 Retirement Age Reforms (Table 2.2)
What It Shows: Many countries are increasing retirement ages due to aging populations and rising life expectancy.
Examples:
- Germany: Retirement age to 66 by 2023, 67 by 2029.
- USA: To 67 for those born in 1960 or later.
- UK: To 66 by 2020, 67 by 2026–28.
- Australia: To 67 by 2023.
- China: To 65 by 2045.
- Japan: Considering raising to 70.
- India: Average 60 years (varies 55–65 by service).
Reasons for Increasing Retirement Age:
- Longer life expectancy (e.g., Japan: 84 years).
- Pressure on pension funds and healthcare due to more elderly.
- Fewer young people to support the economy.
Impact on Economy:
- Keeps experienced workers in the workforce longer.
- Reduces pension costs.
- May create competition for younger workers seeking jobs.
- China’s Delay to 2045: China’s young population is still significant, but it will decline by 2045, necessitating a higher retirement age.
- India’s Context: With a young population, increasing retirement age may not be urgent, but rising life expectancy could require it in the future.
1.5 Literacy and Education
Definition: Literacy rate is the percentage of people who can read, write, and perform basic arithmetic with understanding.
India’s Definition: Population above 7 years who can read, write, and do arithmetic.
Minimum Age for Literacy Calculation:
- Brazil: 15 years.
- USA: 15 years.
- Germany: 15 years.
Importance:
- Indicates socio-economic development.
- Reflects standard of living, women’s status, education facilities, and government policies.
- Higher literacy leads to better economic development, and vice versa.
Global Literacy Rates (Fig. 2.3, 2016):
- Highest Literacy: Central Asia, Europe, North America (near 100%).
- Lowest Literacy: Sub-Saharan Africa (57–72%).
- Gender Gap: Males generally have higher literacy than females, except in regions with full literacy (e.g., Central Asia).
- Conclusion: Literacy varies across regions. Developed regions have higher rates, while developing regions, especially Sub-Saharan Africa, lag. Gender equality in literacy is better in developed regions.
1.6 Occupational Structure
Definition: The distribution of the working population (15–59 years) across primary, secondary, tertiary, and quaternary sectors.
Importance:
- Reflects a country’s economic development.
- Developed economies have more workers in secondary, tertiary, and quaternary sectors.
- Developing economies have more workers in primary sectors (e.g., agriculture).
India’s Occupational Structure (Table 2.3, 1901–2011):
Primary Sector (agriculture, fishing, mining):
- Highest: 72.7% in 1951.
- Declining trend: 48.96% by 2011.
Secondary Sector (manufacturing, construction):
Increasing trend: 12.5% in 1901 to 23.52% in 2011.
Tertiary Sector (trade, transport, services):
Increasing trend: 15.6% in 1901 to 27.52% in 2011.
Key Observations:
- Primary sector employment is decreasing as India industrializes.
- Secondary and tertiary sectors are growing, indicating economic development.
- Lowest occupation: Mining (0.1% in 1901).
1.7 Rural-Urban Composition
Definition: The division of population into rural (primary activities like farming) and urban (non-primary activities like industries, services).
Differences:
- Lifestyle: Rural areas focus on agriculture; urban areas focus on industries and services.
- Age-Sex Structure: Urban areas often have more working-age males, affecting sex ratio.
- Development: Urban areas are more developed with better infrastructure.
- Criteria: Varies by country, but generally based on occupation and residence.
2. Migration
Definition: The movement of people from one place to another, within a country or across borders, for short or long periods, voluntarily or involuntarily.
Types of Migration:
By Region:
- Internal Migration: Within a country (e.g., moving from a village to Mumbai).
- External Migration: To another country (e.g., moving to the USA for education).
By Duration:
- Short-Term/Seasonal: Temporary, e.g., sugarcane workers in Maharashtra.
- Long-Term: For an extended period, may return occasionally.
- Permanent: Never returning to the original place.
By Intention:
- Voluntary: By choice (e.g., for jobs, education).
- Involuntary: Forced (e.g., due to war, natural disasters).
Reasons for Migration
- Push Factors: Factors that force people to leave (e.g., unemployment, drought, war).
- Pull Factors: Factors that attract people (e.g., jobs, education, better living standards).
Examples:
- Physical: Natural disasters like earthquakes or floods.
- Economic: Job opportunities, better income.
- Social: Marriage, education, discrimination.
- Political: War, political instability.
Impact of Migration
On Donor Region (where people leave):
- Positive: Reduced pressure on resources.
- Negative: Loss of workforce, higher dependency ratio, underused facilities (e.g., Kerala’s high sex ratio due to male migration).
On Recipient Region (where people move):
- Positive: Economic growth, new ideas, technological development.
- Negative: Pressure on housing, water, transport; rise in slums, crime, and economic inequality.
- Example: Mumbai has a low sex ratio (832) due to male-dominated migration.
Table 2.4: Impact of Migration
| Type of Migration | Positive Effects | Negative Effects |
|---|---|---|
| International Migration | Employment, improved financial status | Resource strain, risk of deportation |
| Internal Migration | Better opportunities, urban growth | Overcrowding, loss of rural workforce |
| Rural to Urban Migration | Access to jobs, education | Slums, pressure on urban infrastructure |
| Urban to Rural Migration | Reduced urban congestion | Limited facilities in rural areas |
| Rural to Rural Migration | Balanced rural development | Resource competition in recipient rural areas |
| Urban to Urban Migration | Economic growth, innovation | Increased urban inequality, overcrowding |
| Seasonal/Temporary Migration | Temporary income, flexibility | Unstable employment, poor living conditions |
Leave a Reply