
Population : Part – 1 – Solutions
Exercise
Q.1) Identify the correct correlation: A: Assertion; R: Reasoning
1. A: Areas which have fertile soil have dense population.
R: Fertile soils are good for agriculture.
Answer: 3) Both A and R are correct and R is the correct explanation of A.
Explanation: Fertile soils support intensive agriculture, which sustains larger populations, making both the assertion and reasoning correct, with R explaining A.
2. A: Population of a region does not change.
R: Birth rate, death rate, and migration affect the population of a region.
Answer: 2) Only R is correct.
Explanation: The population of a region changes due to birth rate, death rate, and migration, making A incorrect. R is correct as it identifies factors affecting population change.
3. A: In stage 2, death rate reduces but birth rate is constant.
R: The population increases rapidly in stage 2.
Answer: 3) Both A and R are correct and R is the correct explanation of A.
Explanation: In stage 2 of the Demographic Transition Theory, death rates decline due to improved healthcare, while birth rates remain high, leading to rapid population growth. R explains A correctly.
Q.2) Write short notes on:
1. Impact of relief on population distribution:
Relief, or landforms, significantly affects population distribution. Flat plains and gentle slopes, such as the Ganges plains, are densely populated because they are ideal for agriculture, infrastructure development, and industry. In contrast, mountainous and hilly areas, like the Himalayas, are sparsely populated due to difficult terrain, limited accessibility, and challenges in farming or building infrastructure. However, some highland areas, like Dehradun or Leh, may have concentrated populations if livelihoods are available.
2. Correlation between birth rates and death rates:
Birth rates and death rates determine population growth or decline. High birth and death rates (Stage 1) result in stable or low population growth. High birth rates with decreasing death rates (Stage 2) cause rapid population growth, known as population explosion. In Stage 3, both rates decline, but birth rates remain higher, leading to slower growth. In Stage 4, low and similar birth and death rates result in minimal growth. In Stage 5, very low birth rates and slightly higher death rates may lead to population decline.
3. Stage 3 of Demographic Transition Theory:
Stage 3, or the late expanding stage, is characterized by declining death rates and decreasing birth rates. Population growth continues but at a slower rate as birth rates exceed death rates. Economic progress raises living standards, reducing poverty. Education levels improve, and awareness of family planning grows, leading to smaller family sizes. Secondary and tertiary activities expand, and countries like China, transitioning from developing to developed status, are in this stage.
Q.3) Give geographical reasons:
1. India is passing through Stage 3 of demographic transition:
India is in Stage 3 because its death rates have significantly declined due to improved healthcare and sanitation, while birth rates are also decreasing due to increased education, urbanization, and family planning awareness. However, birth rates remain higher than death rates, leading to continued population growth, characteristic of the late expanding stage.
2. Population distribution is uneven:
Population distribution is uneven due to physical factors like relief, climate, water availability, and soil fertility, as well as human factors like economic opportunities, transportation, and urbanization. Fertile plains and coastal areas are densely populated, while deserts, mountains, and snow-covered regions are sparsely populated due to harsh conditions and limited resources.
3. Population increases because of transportation facilities:
Transportation facilities, such as roads, highways, and ports, improve accessibility, encouraging settlement and economic activities. For example, the construction of highways (as seen in Fig. 1.5) or the Suez Canal has increased population density in connected areas by facilitating trade, industry, and migration, making regions more habitable.
4. Secondary and tertiary activities increase in the third stage of demographic transition:
In Stage 3, economic development accelerates, raising income levels and living standards. This shifts the economy from primary activities (agriculture) to secondary (manufacturing) and tertiary (services) sectors. Urbanization, education, and technological advancements create more jobs in industries and services, supporting the growing population.
5. Population may increase though birth rates are low:
Population can increase despite low birth rates if death rates are even lower, as seen in Stage 4 of the Demographic Transition Theory. Improved healthcare, sanitation, and living standards reduce mortality, allowing more people to survive, resulting in minimal but positive population growth.
6. Population density is a function of population and area of a region:
Population density is calculated as the total population divided by the total area (in sq. km.). It reflects how crowded a region is. Areas with large populations but small land areas, like Bangladesh, have high densities, while regions with small populations and vast areas, like Australia, have low density, making density a direct function of these two variables.
Q.4) Answer in detail:
1. Explain the physical factors affecting distribution of population:
Answer:
Physical factors significantly influence population distribution:
- Relief (Landforms): Flat plains and gentle slopes, like the Ganges or Mississippi flood plains, are densely populated due to ease of agriculture, road construction, and industrial development. Mountainous areas, such as the Himalayas, are sparsely populated due to difficult terrain and limited resources, though exceptions like Dehradun exist where livelihoods are available.
- Climate: Areas with equable climates, like Mediterranean regions, attract dense populations due to comfortable living conditions. Extreme climates, such as hot deserts or polar regions, are sparsely populated, except by adapted groups like Eskimos. Equatorial areas like the Amazon basin are sparsely populated due to heavy rainfall and dense forests.
- Availability of Water: Water is essential for life, making river valleys (e.g., Nile, Ganges) and coastal plains densely populated. Oases in deserts, like Phalodi in the Thar Desert, also support populations due to water availability.
- Soils: Fertile soils, such as loamy or volcanic soils (e.g., Java, Mississippi flood plains), support intensive agriculture, leading to high population density. Areas with infertile soils, like deserts, have low populations.
These factors collectively determine where populations concentrate or remain sparse.
2. In the first and fifth stage of the demographic transition, population growth is almost nil. What is the difference between the two stages then?
Answer:
In both Stage 1 (High Stationary) and Stage 5 (Declining) of the Demographic Transition Theory, population growth is minimal or nil, but the reasons and conditions differ significantly:
- Stage 1 (High Stationary): Both birth and death rates are high, balancing each other, resulting in stable or low population growth. This stage occurs in pre-industrial societies with limited economic development, reliance on agriculture, low education, and poor healthcare. High death rates stem from diseases, malnutrition, and lack of medical facilities, while high birth rates are driven by cultural norms favoring large families. No country is currently in this stage.
- Stage 5 (Declining): Birth rates are very low, often equal to or lower than death rates, leading to minimal or negative population growth. This stage occurs in highly developed countries (e.g., Sweden, Finland) with advanced economies, high living standards, and extensive tertiary activities. Low birth rates result from education, career-focused lifestyles, and family planning, while low death rates are due to superior healthcare. Aging populations and higher elderly proportions are common, potentially causing population decline.
The key difference lies in the economic, social, and technological contexts: Stage 1 reflects underdevelopment, while Stage 5 reflects advanced development with potential demographic challenges like aging populations.
3. Discuss the problems faced by countries in stage 4 and stage 5:
Answer:
Stage 4 (Low Stationary): Countries in this stage, like the USA, face:
- Aging Population: Low birth rates and low death rates increase the proportion of elderly citizens, straining pension systems and healthcare services.
- Labor Shortages: Fewer young workers may lead to labor shortages, impacting economic productivity unless offset by immigration or automation.
- Economic Pressure: High living standards require sustained economic growth to support advanced healthcare, education, and infrastructure, which can be challenging.
- Urban Challenges: Rapid urbanization may lead to overcrowding, housing shortages, and environmental degradation in cities.
Stage 5 (Declining): Countries like Sweden and Finland face more severe issues:
- Population Decline: Very low birth rates and slightly higher death rates can reduce population size, shrinking the workforce and consumer base, which may slow economic growth.
- Aging Crisis: A high proportion of elderly citizens increases healthcare and pension costs, placing a heavy burden on a smaller working-age population.
- Dependency Ratio: A high dependency ratio (more non-working elderly relative to workers) strains public resources and social welfare systems.
- Social and Cultural Shifts: Low birth rates may lead to cultural concerns about national identity or population sustainability, prompting policies to encourage higher birth rates or immigration.
- Economic Stagnation: A shrinking population can reduce domestic markets, affecting industries and economic vitality unless mitigated by innovation or immigration.
Both stages require strategic policies to manage demographic and economic challenges, such as promoting immigration, increasing birth rates, or enhancing productivity through technology.
Q.5) Draw a neat labelled diagram for demographic transition theory and its various stages:
Answer:
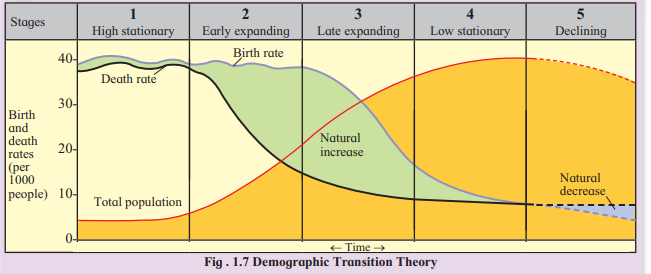
Diagram Description:
- Title: Demographic Transition Theory
- X-Axis: Time (labeled as “← Time →”)
- Y-Axis: Natural Increase/Decrease Rates (per 1000 people), ranging from -10 to 50.
Lines:
- Blue Line: Birth Rate (starts high at ~40 in Stage 1, remains high in Stage 2, declines in Stage 3, becomes low in Stage 4, and very low in Stage 5).
- Black Line: Death Rate (starts high at ~30 in Stage 1, declines sharply in Stage 2, continues to decrease in Stage 3, becomes very low in Stage 4, and remains low in Stage 5).
- Green Area: Natural Increase (area between birth and death rates where birth rate exceeds death rate, prominent in Stages 2 and 3).
- Blue Area: Natural Decrease (area where death rate exceeds birth rate, possible in Stage 5).
Stages (labeled on the graph):
Stage 1: High Stationary (high birth and death rates, stable population).
Stage 2: Early Expanding (high birth rate, declining death rate, rapid growth).
Stage 3: Late Expanding (declining birth and death rates, slower growth).
Stage 4: Low Stationary (low birth and death rates, minimal growth).
Stage 5: Declining (very low birth rate, low death rate, possible decline).
Additional Labels: Indicate total population growth trend (stable in Stage 1, rapid increase in Stage 2, slower increase in Stage 3, minimal in Stage 4, and decline in Stage 5).
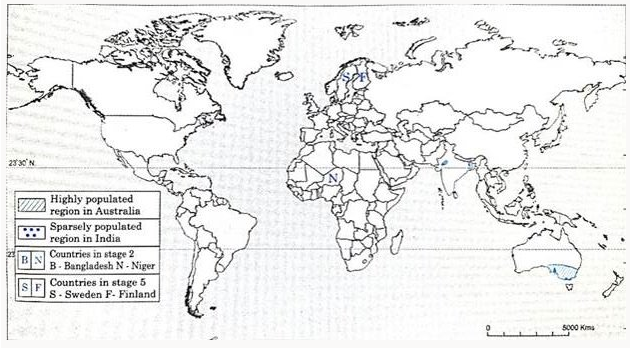
Q. 6) On an outline map of the world, show the following with index :
1) Highly populated region in Australia.
2) Sparsely populated region in India.
3) Any 2 countries in stage 5 of Demographic Transition Theory
4) Any 2 countries in stage 2 of Demographic Transition Theory
Answer:
Intext Questions and Answers
1. Observe the pie-charts shown in Fig 1.1 carefully and answer the following questions. (pg.no – 1)
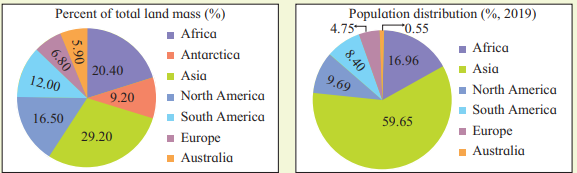
- Which continent has least population?
- Which continent has the least landmass and also least population?
- Which continent has the most land mass as well as most of the population?
- Which continent is missing in one of the pie charts? Why?
Answer:
- The continent which has the least population is Australia.
- The continent which has the least land mass and also least population is Australia.
- The continent which has the most land mass and also most population is Asia.
- The continent of Antarctica is missing in population distribution chart, because it has no permanent human settlement.
2. The satellite image given in Fig. They show the same area from two different periods. (Text book pg.no – 6)
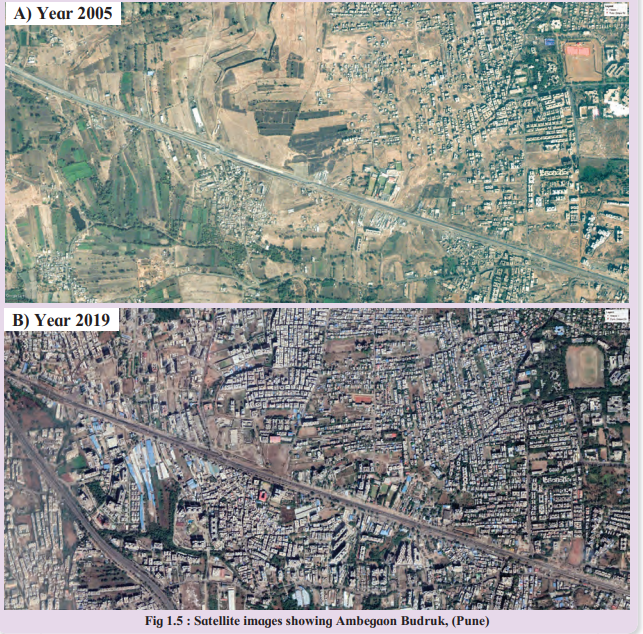
1. What difference do you see?
2. What might have caused these changes?
Answer:
1. The satellite image ‘A’ is image of the year 2005 and satellite image ‘B’ is of the year 2019. That means there is a difference of 14 years in these two images.
2. In image ‘A’ you can see that there are a few roads, limited settlements and most of the areas are covered by agricultural fields, and there is thin population.
3. When we compare the image ‘A’ with the image ‘B’, we find that in image ‘B’ the number of major roads (highway) and minor roads have increased. As a result, the area has become more accessible and thickly populated.
Due to development of industries and employment opportunities there is development of transport.
3. Look at the below figure and answer the questions that follow: (pg.no – 7)
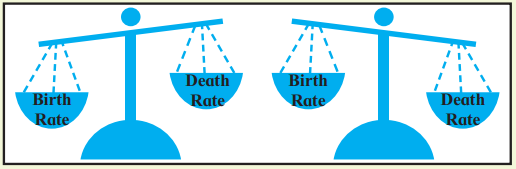
- What does the image show?
- What happens to the population when the deaths are more than births?
- What happens to the population when births are more than deaths?
- What happens when both are same? Is it possible?
Answer:
- The image shows balance between birth rate and death rate.
- Population growth may be less or in some countries there may be negative growth.
- When births are more than deaths, then population growth is faster.
- When both births and deaths are same, population will be stagnant. This is not possible for any country.
Leave a Reply