
Bar Graph (बार ग्राफ) In Hindi
बार ग्राफ, जिसे स्तंभ ग्राफ (Column Graph) भी कहा जाता है, डेटा को दर्शाने का एक चित्रात्मक तरीका है। यह आयताकार स्तंभों का उपयोग करता है, जिनकी ऊंचाई या लंबाई डेटा के मूल्यों के अनुरूप होती है।
बार ग्राफ की मुख्य विशेषताएं:
1. आयताकार स्तंभ: डेटा को समान चौड़ाई वाले स्तंभों द्वारा दर्शाया जाता है, जिनकी ऊंचाई या लंबाई भिन्न होती है।
2. अक्ष: बार ग्राफ में दो अक्ष होते हैं: क्षैतिज अक्ष (x-अक्ष) और ऊर्ध्वाधर अक्ष (y-अक्ष)।
3. लेबल: x-अक्ष लेबल तुलना किए जा रहे श्रेणियों को दर्शाते हैं। y-अक्ष लेबल डेटा के लिए माप की इकाई को दर्शाता है।
4. स्केल: y-अक्ष में एक स्केल होता है जो दर्शाए जा रहे मूल्यों को दिखाता है। स्केल सुसंगत और पढ़ने में आसान होना चाहिए।
Bar Graph In English
A bar graph is a graphical representation of data using rectangular bars. The length or height of each bar is proportional to the value it represents. Bar graphs are used to compare and contrast different categories of data.
Here are the key features of a bar graph:
1. Rectangular bars: The data is represented by bars that are all the same width but have different heights or lengths.
2. Axes: A bar graph has two axes: a horizontal axis (x-axis) and a vertical axis (y-axis).
3. Labels: The x-axis labels identify the categories being compared. The y-axis label identifies the unit of measurement for the data.
4. Scale: The y-axis has a scale that shows the values being represented. The scale should be consistent and easy to read.
Types of Bar Graphs
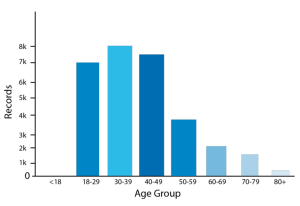
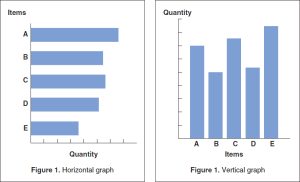
1. Vertical Bar Graph: This is the most common type. Categories are listed along the horizontal (x) axis, and values are shown on the vertical (y) axis. The height of each bar represents the value for that category.
2. Horizontal Bar Graph: This flips the orientation. Categories are listed along the vertical (y) axis, and values are shown on the horizontal (x) axis. The length of each bar represents the value. Horizontal bar graphs are useful when you have long category labels or want to emphasize comparisons across categories.
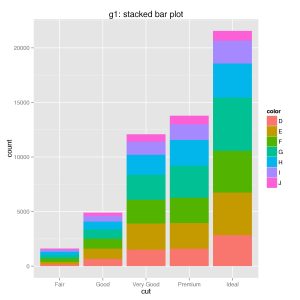
3. Stacked Bar Graph: This type of graph shows how a whole can be broken down into its component parts. Each bar represents a total value, and the bar is divided into segments to show the contribution of each sub-category. Stacked bar graphs are useful for showing how different parts contribute to a whole.
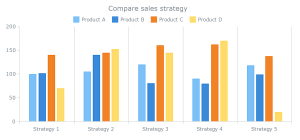
4. Grouped Bar Graph: This type of graph compares multiple sets of data for each category. Each category has a cluster of bars, with each bar representing a different data set. Grouped bar graphs are useful for comparing trends or values across different variables within the same categories.
5. Percentile Bar Graph: This type of graph shows the distribution of data across percentiles. Each bar represents a specific percentile range (e.g., 0-25%, 25-50%, etc.), and the height of the bar represents the number of data points that fall within that percentile range. Percentile bar graphs are useful for understanding how data is spread out.

Leave a Reply