eVidyarthi Exam Preparation
Main Menu
  • School
    • CBSE English Medium
    • CBSE Hindi Medium
    • UP Board
    • Bihar Board
    • Maharashtra Board
    • MP Board
    • Close
  • Sarkari Exam Preparation
    • State Wise Competitive Exam Preparation
    • All Govt Exams Preparation
    • MCQs for Competitive Exams
    • Notes For Competitive Exams
    • NCERT Syllabus for Competitive Exam
    • Close
  • Study Abroad
    • Study in Australia
    • Study in Canada
    • Study in UK
    • Study in Germany
    • Study in USA
    • Close
Menu
  • Notes Quantitative Aptitude
  • MCQ Quantitative Aptitude
SELECT YOUR LANGUAGE

Frequency Polygon for Competitive Exam – Quantitative Aptitude

Frequency Polygon (आवृत्ति बहुभुज) In Hindi

Frequency polygon को हिंदी में ‘आवृत्ति बहुभुज’ कहा जाता है। यह एक प्रकार का रेखांकित ग्राफ है जो एक डेटासेट के वितरण को प्रतिनिधित करता है। यह विशेष रूप से उपयोगी होता है जब आप किसी डेटासेट के विभिन्न श्रेणियों या मानों की आवृत्तियों को दिखाना चाहते हैं।

एक आवृत्ति बहुभुज लगभग हिस्टोग्राम के समान होता है, जिसका उपयोग डेटा के सेट की तुलना करने या संचयी आवृत्ति वितरण प्रदर्शित करने के लिए किया जाता है। यह मात्रात्मक डेटा का प्रतिनिधित्व करने के लिए एक लाइन ग्राफ़ का उपयोग करता है।

Frequency Polygon In English

A frequency polygon is a type of line graph that represents the distribution of a dataset. It is particularly useful for displaying the frequencies of different categories or values in a dataset.

Formula to Find Midpoint of Frequency Polygons

  • Class Mark (Midpoint) = (Upper Limit + Lower Limit) / 2

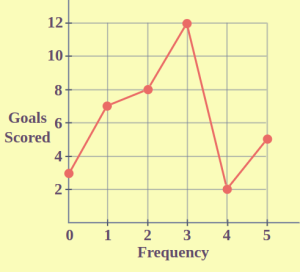
Here’s how to create a frequency polygon:

Collect Data: Gather the dataset you want to visualize. This could be data on any variable or category, such as test scores, ages, or product sales.

Organize Data: Organize the data into groups or categories, if necessary. For numerical data, you may want to create intervals or bins to group similar values together. For categorical data, identify the unique categories.

Calculate Frequencies: Count the number of data points that fall into each group or category. These counts represent the frequencies.

Plot the Points: On a graph, plot each group or category along the x-axis and its corresponding frequency along the y-axis. If you’re using intervals or bins, you can plot the midpoint of each interval.

Connect the Points: Once you’ve plotted all the points, connect them in order from left to right using straight line segments. This creates the frequency polygon.

Optional: Label Axes and Title: Make sure to label the x-axis and y-axis with appropriate units or categories, and add a title to the graph to provide context.

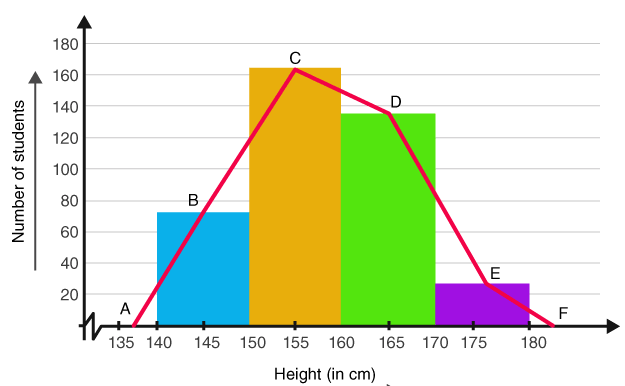
Difference Between Histogram and Frequency Polygons

AspectHistogramFrequency Polygon
Visual PresentationConsists of vertical barsConsists of line segments
Data TypePrimarily used for continuous numerical dataCan represent both continuous and grouped numerical data
SmoothnessProvides a more discrete representationProvides a smoother representation
InterpretationAllows quick visual assessment of central tendency, spread, and shapeEmphasizes overall trend or shape of the distribution

Leave a Reply Cancel reply

Your email address will not be published. Required fields are marked *

Sarkari Exam Preparation Youtube
Subscribe

Ads

UPSC, BPSC, MPPSC, UPPSC, RPSC :- Syllabus, Mock Test and Notes

Rajasthan Public Service Commission (RPSC) Syllabus, Mock Test and Notes.

Uttar Pradesh Public Service Commission (UPPSC) Syllabus, Mock Test and Notes.

Madhya Pradesh Public Service Commission (MPPSC) Syllabus, Mock Test and Notes.

Bihar Public Service Commission (BPSC) Syllabus, Mock Test and Notes.

SSC CHSL, SSC CPO, SSC Steno, SSC GD CGL Syllabus

SSC Combined Graduate Level Exam

UPSC, SSC & Railway Exams Syllabus, Mock Test, Videos, MCQ and Notes

At eVidyarthi, you can prepare for various SSC Combined Graduate Level Exams (SSC CGL, SSC CHSL, SSC CPO, SSC Stenographer). eVidyarthi offers SSC Mock Tests and SSC Pre Syllabus for Combined Graduate Level Exams (including SSC CGL Pre and SSC GD).

सरकारी Exam Preparation

Sarkari Exam Preparation Youtube

Study Abroad

Study in Australia: Australia is known for its vibrant student life and world-class education in fields like engineering, business, health sciences, and arts. Major student hubs include Sydney, Melbourne, and Brisbane. Top universities: University of Sydney, University of Melbourne, ANU, UNSW.

Study in Canada: Canada offers affordable education, a multicultural environment, and work opportunities for international students. Top universities: University of Toronto, UBC, McGill, University of Alberta.

Study in the UK: The UK boasts prestigious universities and a wide range of courses. Students benefit from rich cultural experiences and a strong alumni network. Top universities: Oxford, Cambridge, Imperial College, LSE.

Study in Germany: Germany offers high-quality education, especially in engineering and technology, with many low-cost or tuition-free programs. Top universities: LMU Munich, TUM, University of Heidelberg.

Study in the USA: The USA has a diverse educational system with many research opportunities and career advancement options. Top universities: Harvard, MIT, Stanford, UC Berkeley

Privacy Policies, Terms and Conditions, Contact Us
eVidyarthi and its licensors. All Rights Reserved.