
Measures of central tendency: Mean, Median, Mode, Standard Deviation (केंद्रीय प्रवृत्ति: माध्य, माध्यिका, बहुलक और मानक विचलन) In Hindi
माध्य: माध्य, जिसे अंग्रेजी में “mean” कहा जाता है, एक संख्यात्मक डेटा सेट में सभी संख्याओं का औसत होता है। यह डेटा सेट के “केंद्र बिंदु” का अनुमान लगाने में मदद करता है।
- माध्य = Σx / n
माध्यिका: माध्यिका एक संख्यात्मक डेटा सेट में वह संख्या होती है जो डेटा सेट को दो समान भागों में विभाजित करती है। दूसरे शब्दों में, डेटा सेट में आधे से अधिक संख्याएं माध्यिका से अधिक होती हैं और आधे से कम संख्याएं माध्यिका से कम होती हैं।
माध्यिका ज्ञात करने के लिए, डेटा सेट को आरोही या अवरोही क्रम में व्यवस्थित करें और फिर बीच वाली संख्या को चुनें।
बहुलक: बहुलक एक संख्यात्मक डेटा सेट में वह संख्या होती है जो डेटा सेट में सबसे अधिक बार आती है। दूसरे शब्दों में, बहुलक वह संख्या है जो डेटा सेट में सबसे अधिक बार दोहराई जाती है।
बहुलक ज्ञात करने के लिए, डेटा सेट में प्रत्येक संख्या की आवृत्ति गिनें और फिर सबसे अधिक आवृत्ति वाली संख्या चुनें।
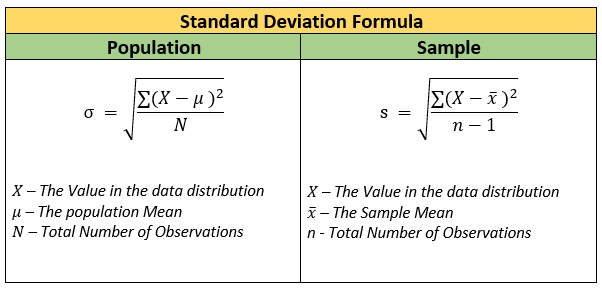
मानक विचलन: मानक विचलन (Standard Deviation) डेटा सेट में संख्याओं के फैलाव का माप है। यह बताता है कि डेटा सेट में संख्याएं औसत (mean) से कितनी दूर हैं।
Measures of central tendency: Mean, Median, Mode, Standard Deviation In English
Mean (x̅ or μ): The mean is the average of all the numbers in a data set. It is calculated by adding all the values and dividing by the number of values.
- Mean = \( \frac{sum of the values}{the number of values} \)
For Example: The ages of five friends are 25, 30, 35, 40, and 45 years. What is the mean age of these five friends?
Solution: To find the mean age, you add up all the ages and then divide by the total number of friends.
Total age = 25 + 30 + 35 + 40 + 45 = 175 years
Number of friends = 5
Mean age = Total age / Number of friends
Mean age = 175 years / 5 = 35 years
So, the mean age of the five friends is 35 years.
Mean of Grouped Data
| Direct Method | Assumed Mean Method | Step Deviation Method |
|---|---|---|
| x̅ = ∑ fixi / ∑ fi where, | x̅ = a + ∑ fixi / ∑ fi where, | x̅ = a + h∑ fixi / ∑ fi where, |
Median (M): The median is the middle value in a set of data when the data is arranged in ascending or descending order. It represents the point where you have half the data greater than the median and half the data less than the median.
Types of Median
| Types | Description |
|---|---|
| Median for Odd Number of Observations | If the number of observations (n) is odd, the median is the value at the (n + 1) / 2 position when the data is sorted in ascending order. |
| Median for Even Number of Observations | If the number of observations (n) is even, the median is the average of the values at the n / 2th and (n / 2)th + 1 positions when the data is sorted in ascending order. |
Median Formula
- Median = [(n + 1)/2]th term
- Median = [(n/2)th term + {(n/2) + 1}th term] / 2
Question: The ages of seven people in a group are: 18, 20, 22, 24, 26, 28, and 30. What is the median age of this group?
Solution: To find the median age, you arrange the ages in ascending order and then find the middle value.
Arranging the ages in ascending order: 18, 20, 22, 24, 26, 28, 30
Since there are seven people, the median will be the fourth value, which is 24.
So, the median age of the group is 24 years.
Median of Grouped Data
Median = l + [(n/2 – cf) / f]×h
where
l is lower limit of median class
n is number of observations
f is frequency of median class
h is class size
cf is cumulative frequency of class preceding the median class.
Mode (Z): The mode is the most frequent value (the one that appears most often) in a data set. It tells you which number shows up more than any other number.
Question: In a survey conducted among 15 students about their favorite colors, the following data was collected:
Blue, Red, Green, Blue, Green, Blue, Yellow, Red, Blue, Green, Green, Yellow, Blue, Red, Green
What is the mode of the students’ favorite colors?
Solution: The mode is the value that appears most frequently in a dataset.
Colors: Blue, Red, Green, Blue, Green, Blue, Yellow, Red, Blue, Green, Green, Yellow, Blue, Red, Green
To find the mode, we identify which color appears most often.
Frequency of colors:
Blue appears 4 times
Red appears 3 times
Green appears 5 times
Yellow appears 2 times
So, the mode is Green since it appears the most frequently (5 times) in the dataset.
Mode Formula
- Mode = Highest Frequency Term
Mode of Grouped Data
- Mode = l + [(f1 + f0) / (2f1 – f0 – f2)] × h
where,
f1 is the frequency of the modal class
f0 is the frequency of the class preceding the modal class
f2 is the frequency of the class succeeding the modal class
h is the size of class intervals
l is the lower limit of modal class
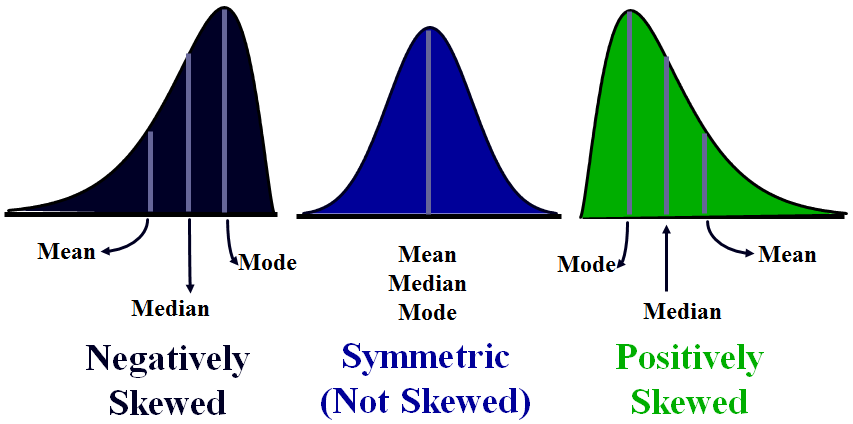
Relation between Mean Median Mode
Empirical Relationship (for moderately skewed distributions):
This relationship states that the mode is equal to three times the median minus two times the mean. We can express this with the formula:
- Mode = 3 Median – 2 Mean
Range Formula
- Range = Highest value – Lowest Value
Standard deviation: Is a statistical measure that tells you how spread out a set of data is from its average value (mean). In simpler terms, it describes how much variation exists within your data.
Here are some key points about standard deviation:
Low standard deviation: Indicates that the data points are clustered closely around the mean.
High standard deviation: Indicates that the data points are spread out over a wider range, with some values being significantly farther from the mean than others.

Leave a Reply