1. What is a weighted average?
Answer:
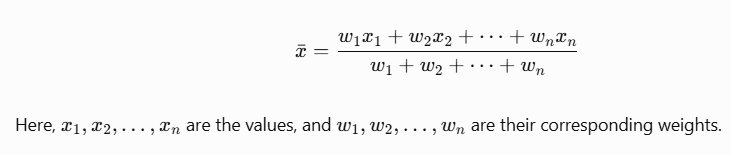
A weighted average is an average in which each value is multiplied by its corresponding weight. It is used when different values have different levels of importance or contribute different amounts to the total.
2. What is the formula for calculating a weighted average?
Answer:
The formula for calculating a weighted average is:
3. Why can we not always calculate the combined average by taking the average of individual averages?
Answer:
We cannot always take the simple average of individual averages because the different groups may contain different numbers of values. A group with more values should have a greater contribution to the combined average. Therefore, we must consider the size of each group.
4. When can the average of individual averages be used correctly?
Answer:
The average of individual averages can be used when all the groups contain the same number of values. In this case, each group contributes equally to the combined average, so we can add the individual averages and divide by the number of groups.
5. How is the combined average of two collections calculated?
Answer:
Suppose two collections contain n and m values, with averages a and b, respectively. Their combined average is calculated using:
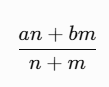
Here, an and bm represent the sums of the values in the two collections.
6. What is the combined average height of the 11 badminton trainees given in the chapter?
Answer:
The group consists of 8 seniors with an average height of 165.5 cm and 3 juniors with an average height of 149.33 cm.
The combined average is:
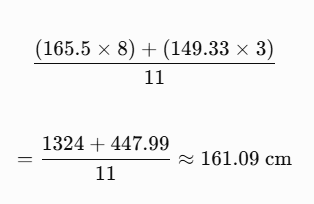
Thus, the average height of the whole group is approximately 161.09 cm. The chapter uses the rounded junior average to obtain approximately the same result.
7. What is meant by the concentration of a mixture?
Answer:
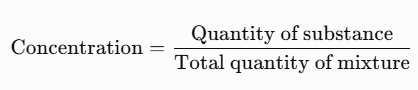
The concentration of a mixture represents the proportion of a particular substance in the entire mixture. It can be calculated by dividing the quantity of that substance by the total quantity of the mixture.
8. What happens when equal quantities of two mixtures with different concentrations are combined?
Answer:
When equal quantities of two mixtures are combined, the concentration of the resulting mixture is the arithmetic mean of their concentrations. For example, mixing equal quantities of lemonade containing 10% and 20% jaggery produces a mixture containing 15% jaggery.
9. What happens when different quantities of mixtures with different concentrations are combined?
Answer:
When different quantities of mixtures are combined, the final concentration depends on both their quantities and their individual concentrations. The larger quantity has a greater influence on the final concentration than the smaller quantity.
10. A bowl contains 500 mL of lemonade with 10% jaggery, and a glass contains 200 mL with 20% jaggery. Find the concentration of jaggery in the mixture.
Answer:
The quantity of jaggery in the bowl is:
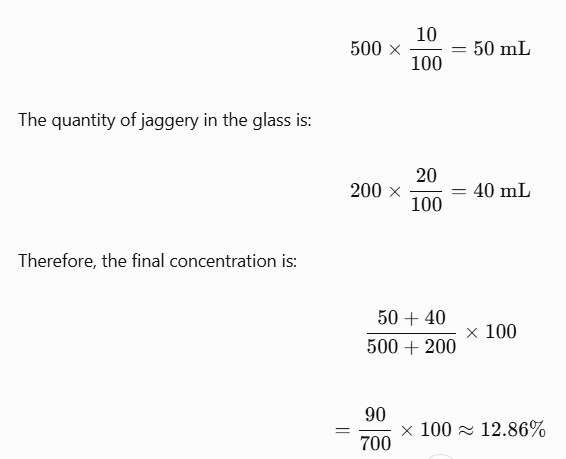
The concentration of jaggery in the mixture is approximately 12.86%.
11. What is an alloy? Explain using the example of brass given in the chapter.
Answer:
An alloy is a mixture of metals or other substances. Brass is an alloy of copper and zinc. In the chapter, different batches of brass containing different percentages of copper are combined to obtain an alloy with a required copper concentration.
12. What is the weight of Batch C in the brass mixture described in the chapter?
Answer:
Batch A weighs 200 kg and contains 70% copper. Batch B weighs 120 kg and contains 50% copper. Batch C contains 45% copper, and the final mixture contains 55% copper.
Let the weight of Batch C be y kg.
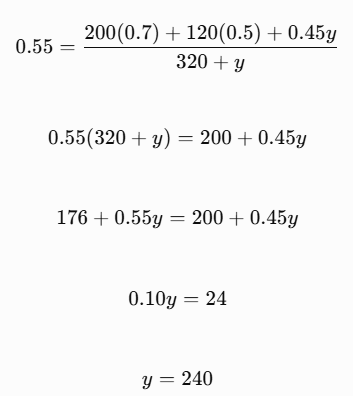
Therefore, Batch C weighs 240 kg.
13. How is the weighted mean used to calculate the final marks of a student?
Answer:
A weighted mean is used when different assessments have different weightages. Each assessment’s marks are multiplied by its assigned weight, and the products are added. The total is then divided by the sum of the weights to calculate the final score.
14. Calculate Rehmat’s annual Mathematics score using the information given in the chapter.
Answer:
Rehmat scored 60% in internal tests, 64% in the project, and 73% in the final examination. Their weightage ratio is 3 : 2 : 5.
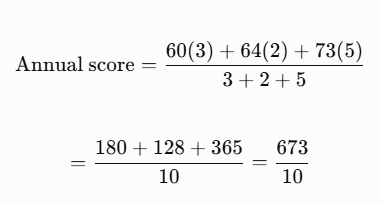
Therefore, Rehmat’s annual Mathematics score is 67.3%.
15. What do the weights assigned to different values indicate?
Answer:
The weights assigned to different values indicate their relative importance or emphasis compared with other values. A higher weight means that the corresponding value has a greater influence on the final weighted average.
16. How is a weighted average used in restaurant ratings?
Answer:
A restaurant’s overall rating can be calculated by assigning different weights to food quality, service, and ambience. Each rating is multiplied by its respective weight, and the products are added and divided by the sum of the weights. This allows the overall rating to reflect the relative importance of each aspect.
17. How can weighted averages be used to calculate the average rating of products?
Answer:
Weighted averages can be used to calculate product ratings by assigning different weights to customer reviews. For example, recent reviews may receive twice the weight of older reviews. This gives more importance to recent customer experiences when calculating the overall rating.
18. What is a cluster-column chart, and why is it useful?
Answer:
A cluster-column chart displays data in groups of columns, making it possible to compare different categories or groups. The clusters may be arranged to compare families across expenditure categories or to compare different expenditure categories within each family.
19. What is a stacked bar chart?
Answer:
A stacked bar chart is a chart in which the smaller bars representing different components are joined together to form one complete bar. The total length represents the combined quantity, while the individual sections represent the contributions of different components.
20. What are the advantages of a stacked bar chart?
Answer:
A stacked bar chart helps compare the totals of different groups while also showing the components that make up those totals. The total length of each bar represents the overall quantity, and the lengths of its smaller sections show the contributions of individual categories.
21. What is a 100% stacked bar chart?
Answer:
A 100% stacked bar chart represents the total of each group using a bar of fixed length corresponding to 100%. The smaller sections show the percentage or proportion contributed by each category. It is useful for comparing the relative distribution of different categories.
22. How is a 100% stacked bar chart similar to a pie chart?
Answer:
Both charts represent the proportions of different components within a total. In a pie chart, the complete circle is divided into sectors according to the quantities. In a 100% stacked bar chart, a fixed-length bar is divided into sections according to the proportions.
23. What is the main difference between a stacked bar chart and a 100% stacked bar chart?
Answer:
A stacked bar chart shows the actual quantities of the components and the total quantity of each group. A 100% stacked bar chart shows the percentage distribution of components within each group, with every bar representing 100%.
24. What can and cannot be inferred from a 100% stacked bar chart?
Answer:
A 100% stacked bar chart helps compare the proportions of different categories within each group. However, it does not reveal the actual numbers represented by the bars. Therefore, a higher percentage in one group does not necessarily mean a greater actual quantity than in another group.
25. What are the main applications and conclusions of the concept of weighted averages and data visualisation?
Answer:
Weighted averages are useful for combining data from groups of different sizes, calculating mixture concentrations, and determining scores or ratings with different weightages. Stacked bar charts help compare totals and their components, while 100% stacked bar charts compare proportions. A stacked bar chart can be converted into a corresponding 100% stacked bar chart, but a 100% stacked bar chart alone does not provide enough information to determine the original actual quantities.

Leave a Reply