Main Menu
  • School
    • Close
    • CBSE English Medium
    • CBSE Hindi Medium
    • UP Board
    • Bihar Board
    • Maharashtra Board
    • MP Board
    • Close
  • English
    • Close
    • English Grammar for School
    • Basic English Grammar
    • Basic English Speaking
    • English Vocabulary
    • English Idioms & Phrases
    • Personality Enhancement
    • Interview Skills
    • Close
  • Sarkari Exam Prep
    • Close
    • All Govt Exams Preparation
    • MCQs for Competitive Exams
    • Notes For Competitive Exams
    • NCERT Syllabus for Competitive Exam
    • Close
  • Study Abroad
    • Close
    • Study in Australia
    • Study in Canada
    • Study in UK
    • Study in Germany
    • Study in USA
    • Close
Class 6th Maths || Menu
  • MCQ Maths Class 6
  • Important Questions Maths Class 6
  • Question Answer Maths Class 6
  • Notes Maths Class 6
  • Important Formulas Maths Class 6
  • Book Maths Class 6
  • Chapter Wise Practice Papers Maths Class 6
  • Sample Papers Maths Class 6
  • Previous Year Papers Maths Class 6
  • Maths Class 6

Maths Class 6 Exercise 9.4 Question Answer

Advertisement

Solutions For All Chapters Maths Class 6

NCERT Solutions for Class 6 Maths Chapter 9 Data Handling Ex 9.4

Ex 9.4 Class 6 Maths Question 1.
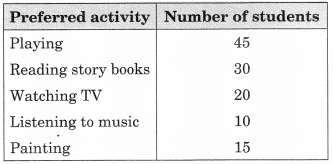
A survey of 120 school students was done to find which activity they prefer to do in their free time.

Draw a bar graph to illustrate the above data taking scale of 1 unit length = 5 students. Which activity is preferred by most of the students other than playing?

Solution:

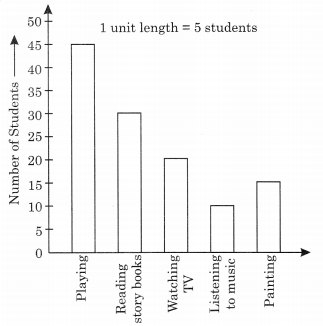
From the given information, we have the following bar graph.

Activity reading story books is preferred by the most of the students other than playing.

Ex 9.4 Class 6 Maths Question 2.
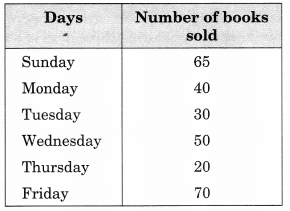
The number of Mathematics books sold by a shopkeeper on six consecutive days is shown below:

Draw a bar graph to represent the above information choosing the scale of your choice.

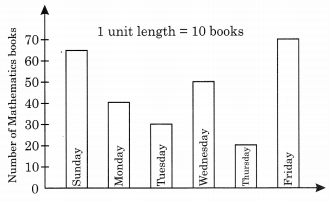
Solution:

From the given information, we have the following bar graph:

Ex 9.4 Class 6 Maths Question 3.
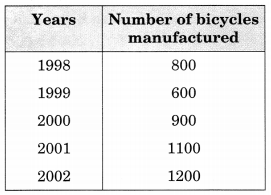
Following table shows the number of bicycles manufactured in a factory during the years 1998 to 2002. Illustrate this data using bar graph. Choose a scale of your choice.

(a) In which year were the maximum number of bicycles manufactured?
(b) In which year were the minimum number of bicycles manufactured?

Solution:

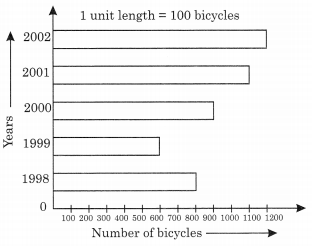
From the given information, we have:
(a) In the year of 2002, the maximum number of the bicycles were manufactured.
(b) In the year of 1999, the minimum number of the bicycles were manufactured.

Ex 9.4 Class 6 Maths Question 4.
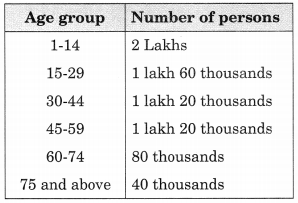
Number of persons in various age groups in a town is given in the following table.

Draw a bar graph to represent the above information and answer the following questions, (take 1 unit length = 20 thousands)
(a) Which two age groups have same population?
(b) All persons in the age group of 60 and above are called senior citizens. How many senior citizens are there in the town?

Solution:

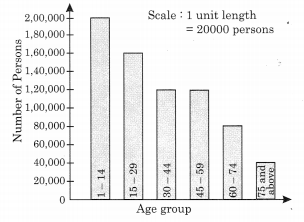
From the above information, we have the bar graph.

(a) Age groups of 30 – 44 and 45 – 59 have the same population.
(b) Number of Senior citizens are 80,000 + 40,000 = 1,20,000
Leave a Reply Cancel reply

Your email address will not be published. Required fields are marked *

Advertisement

CBSE Delhi Question Answer of Chapters in PDF

Free Sample Papers and Previous Years' Question Papers for CBSE Exams from the Official CBSE Academic Website (CBSE.nic.in) in Delhi, Rajasthan, Uttar Pradesh and Bihar

Download CBSE / NCERT Book, Notes & MCQ Online Test / Mock Test

Online Quiz with Answers for Objective Questions in Hindi and English

Advertisement

Maharashtra Board Marathi & English Medium

Just Launched! Access Maharashtra Board Exam MCQs, Previous Year Papers, Textbooks, Solutions, Notes, Important Questions, and Summaries—available in both Marathi and English mediums—all in one place Maharashtra Board

Android APP

सरकारी Exam Preparation

Sarkari Exam Preparation Youtube

CBSE – दिल्ली, उत्तर प्रदेश, मध्य प्रदेश, बिहार, राजस्थान & हरियाणा Board हिंदी माध्यम

कक्षा 6 to 8 हिंदी माध्यम
कक्षा 9 & 10 हिंदी माध्यम
कक्षा 11 हिंदी माध्यम

State Board

यूपी बोर्ड 6,7 & 8
बिहार बोर्ड हिंदी माध्यम

CBSE Board

Mathematics Class 6
Science Class 6
Social Science Class 6
हिन्दी Class 6
सामाजिक विज्ञान कक्षा 6
विज्ञान कक्षा 6

Mathematics Class 7
Science Class 7
SST Class 7
सामाजिक विज्ञान कक्षा 7
हिन्दी Class 7

Mathematics Class 8
Science Class 8
Social Science Class 8
हिन्दी Class 8

Mathematics Class 9
Science Class 9
English Class 9

Mathematics Class 10
SST Class 10
English Class 10

Mathematics Class XI
Chemistry Class XI
Accountancy Class 11

Accountancy Class 12
Mathematics Class 12

Learn English
English Through हिन्दी
Job Interview Skills
English Grammar
हिंदी व्याकरण - Vyakaran
Microsoft Word
Microsoft PowerPoint
Adobe PhotoShop
Adobe Illustrator
Learn German
Learn French
IIT JEE
Privacy Policies, Terms and Conditions, About Us, Contact Us
Copyright © 2025 eVidyarthi and its licensors. All Rights Reserved.