Notes For All Chapters Maths Class 6
Data
Data is a collection of raw facts and figures that give you information.
Recording Data
Recording of data depends upon the requirement of the data. Everybody has different ways to record data.
If we have to compare the choice of the people about certain movies then we have to collect the data of the survey which tells the choice of the people about those movies.
Organization of Data
Raw data is difficult to read, so we have to organize it in such a way so that we can use it in need.
Data can be organized in a tabular form.
Data is represented in a tabular form using frequency distribution and the tally marks.
Frequency tells the number of times the particular observation happened.
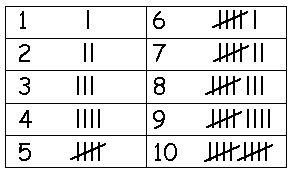
Tally marks are used to show the frequency of the data.
Tally marks are represented as
Example
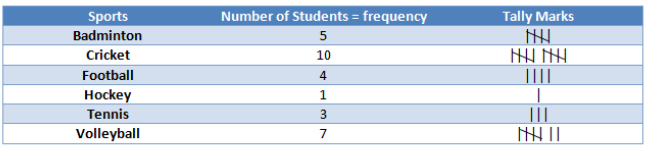
There are 30 students in a class. They have to choose one sport each for the sports period.5 took badminton, 10 took cricket, 4 took football, 1 took hockey, 3 took tennis and 7 went for volleyball. Represent this data in the frequency distribution table.
Solution
(i) To make a frequency distribution table-
(ii) Make a table with three columns.
(iii) Write the name of sports in the first column.
(iv) Write the respective frequencies in front of each sport.
(v) Mark the tally marks according to the frequency given.
Pictograph
If we represent the data with the pictures of objects instead of numbers then it is called Pictograph. Pictures make it easy to understand the data and answer the questions related to it by just seeing it.
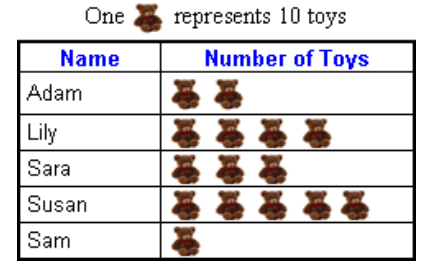
We can easily answer the questions like who has a maximum number of toys, who has the least number of toys etc.
Interpretation of a Pictograph
In the pictograph, we have to understand it and get the information from the pictures given.
If we have to represent more number of items then we can use the key which represents more numbers with one picture.
Example
The number of cars parked in a parking lot every day is given in the pictograph.
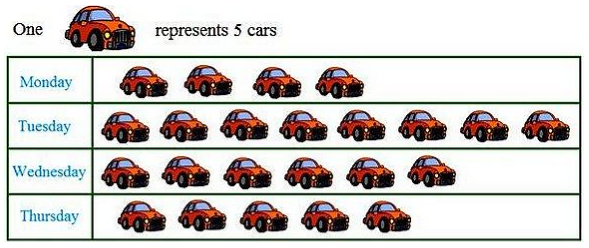
(i) Find the day when the highest number of cars are parked and how many?
(ii) When the least number of cars did park?
Solution
In the above pictograph one car represent 5 cars.
a. As there is the maximum number of cars is shown on Tuesday so the highest number of cars was parked on Tuesday.
![]()
Hence, 40 cars were parked on Tuesday in the parking lot.
b. Least number of cars were parked on Monday as there are only 4 pictures of cars are shown on that day.
Drawing a Pictograph
Drawing a pictograph is an interesting task but it may be difficult to draw some difficult pictures repeatedly as we had used cars in the above example so we can use easy symbols to draw a pictograph.
We must use a proper key of the symbols so that it could be easily understood by anyone.
Example
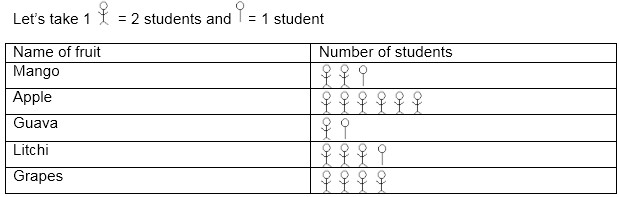
The following table shows the choice of the fruits of the 35 students of class 3.represent the data in a pictograph.
| Name of fruit | Number of students |
| Mango | 5 |
| Apple | 12 |
| Guava | 3 |
| Litchi | 7 |
| Grapes | 8 |
Solution
Bar Graph
As the pictograph is a very time-consuming process, so we can use another way to represent data.
If we use the bars of the same width with equal spacing to represent the data in which the length of the bars represent the frequency is called Bar Graph or Bar Diagram.
Interpretation of a Bar Graph
Example
The following graph tells the favourite colours in a class of 30 students.
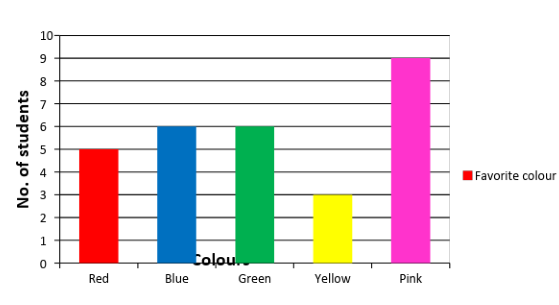
Answer the following questions:
a. Which colour is liked by the maximum number of students?
b. Which colour is liked by the same number of students?
Solution
a. The graph shows that the pink colour is liked by 9 students so it is the favourite colour of the maximum number of students.
b. Blue and green colour bars are equal in length and both are liked by 6 students.
Drawing a Bar Graph
Drawing a bar graph is an interesting task, but we must choose an appropriate scale to draw the bar graph. It depends upon our own choice that what we are taking for the scale.
Example
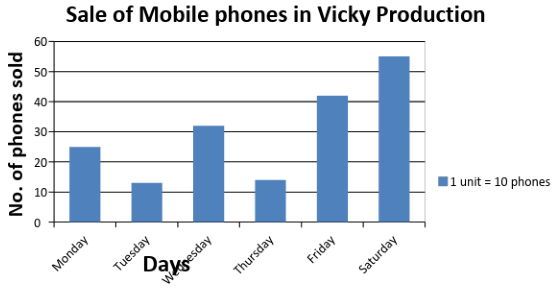
The daily sale of mobile phones in Vicky production is given below. Draw the bar graph to represent the data.
| Days | Monday | Tuesday | Wednesday | Thursday | Friday | Saturday |
| No. of phones sold | 25 | 13 | 32 | 14 | 42 | 55 |
Solution
Steps to make a bar graph-
(i) Draw two lines, one horizontal and one vertical in L shape.
(ii) Mark days on the horizontal line and no. of phones on the vertical line.
(iii) Take a suitable scale for the number of phones and mark on the vertical line. Let 1 unit = 10 phones.
(iv) Use the bars of equal width and draw them with the frequency given at the same distance.
The height of the bars tells the sale of the mobile phones in Vicky production.
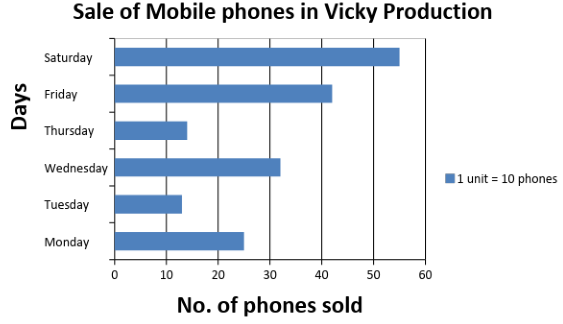
This same bar graph can be made by interchanging the positions of the days and the number of phones.

Thank you very much dear ❤️❤️❤️ may your All dreams come True and your generation get success in life, again thank you for providing this knowledge and facilities to the hard working students